
This jumpstart deploys an end-to-end demo that showcases a modern manufacturing scenario: streaming machine telemetry, ingesting SAP master data, building a Lakehouse + Eventhouse, and surfacing insights through Power BI reports, a real-time KQL dashboard, and an AI Data Agent.
✨ What's Inside
- 📡 Eventstream — ingests live MQTT machine telemetry into the Eventhouse
- 🔥 Eventhouse / KQL Database — stores and queries high-volume sensor data in real time
- 🏞️ Lakehouse — holds SAP master data (customers, suppliers, plants, equipment, products) and curated production quality data
- 📓 Notebooks — simulate machine data, ingest SAP data, process master data, and run Spark Structured Streaming
- 🪈 Data Pipeline — orchestrates the end-to-end flow
- 📊 Reporting — Power BI report, Semantic Model, and an MQTT Real-Time Dashboard
- 🤖 AI Data Agent — natural-language Q&A over the manufacturing data
🛠️ Post-Deployment Setup
After installing the jumpstart, run the PostDeploymentNotebook. It wires everything together — loading sample data, configuring connections, and getting the demo ready to use.
🎉 Have Fun
Once the PostDeploymentNotebook has been running for about 5 minutes, you can already see streaming data visualized in the Real-Time Dashboard (Reporting Folder).
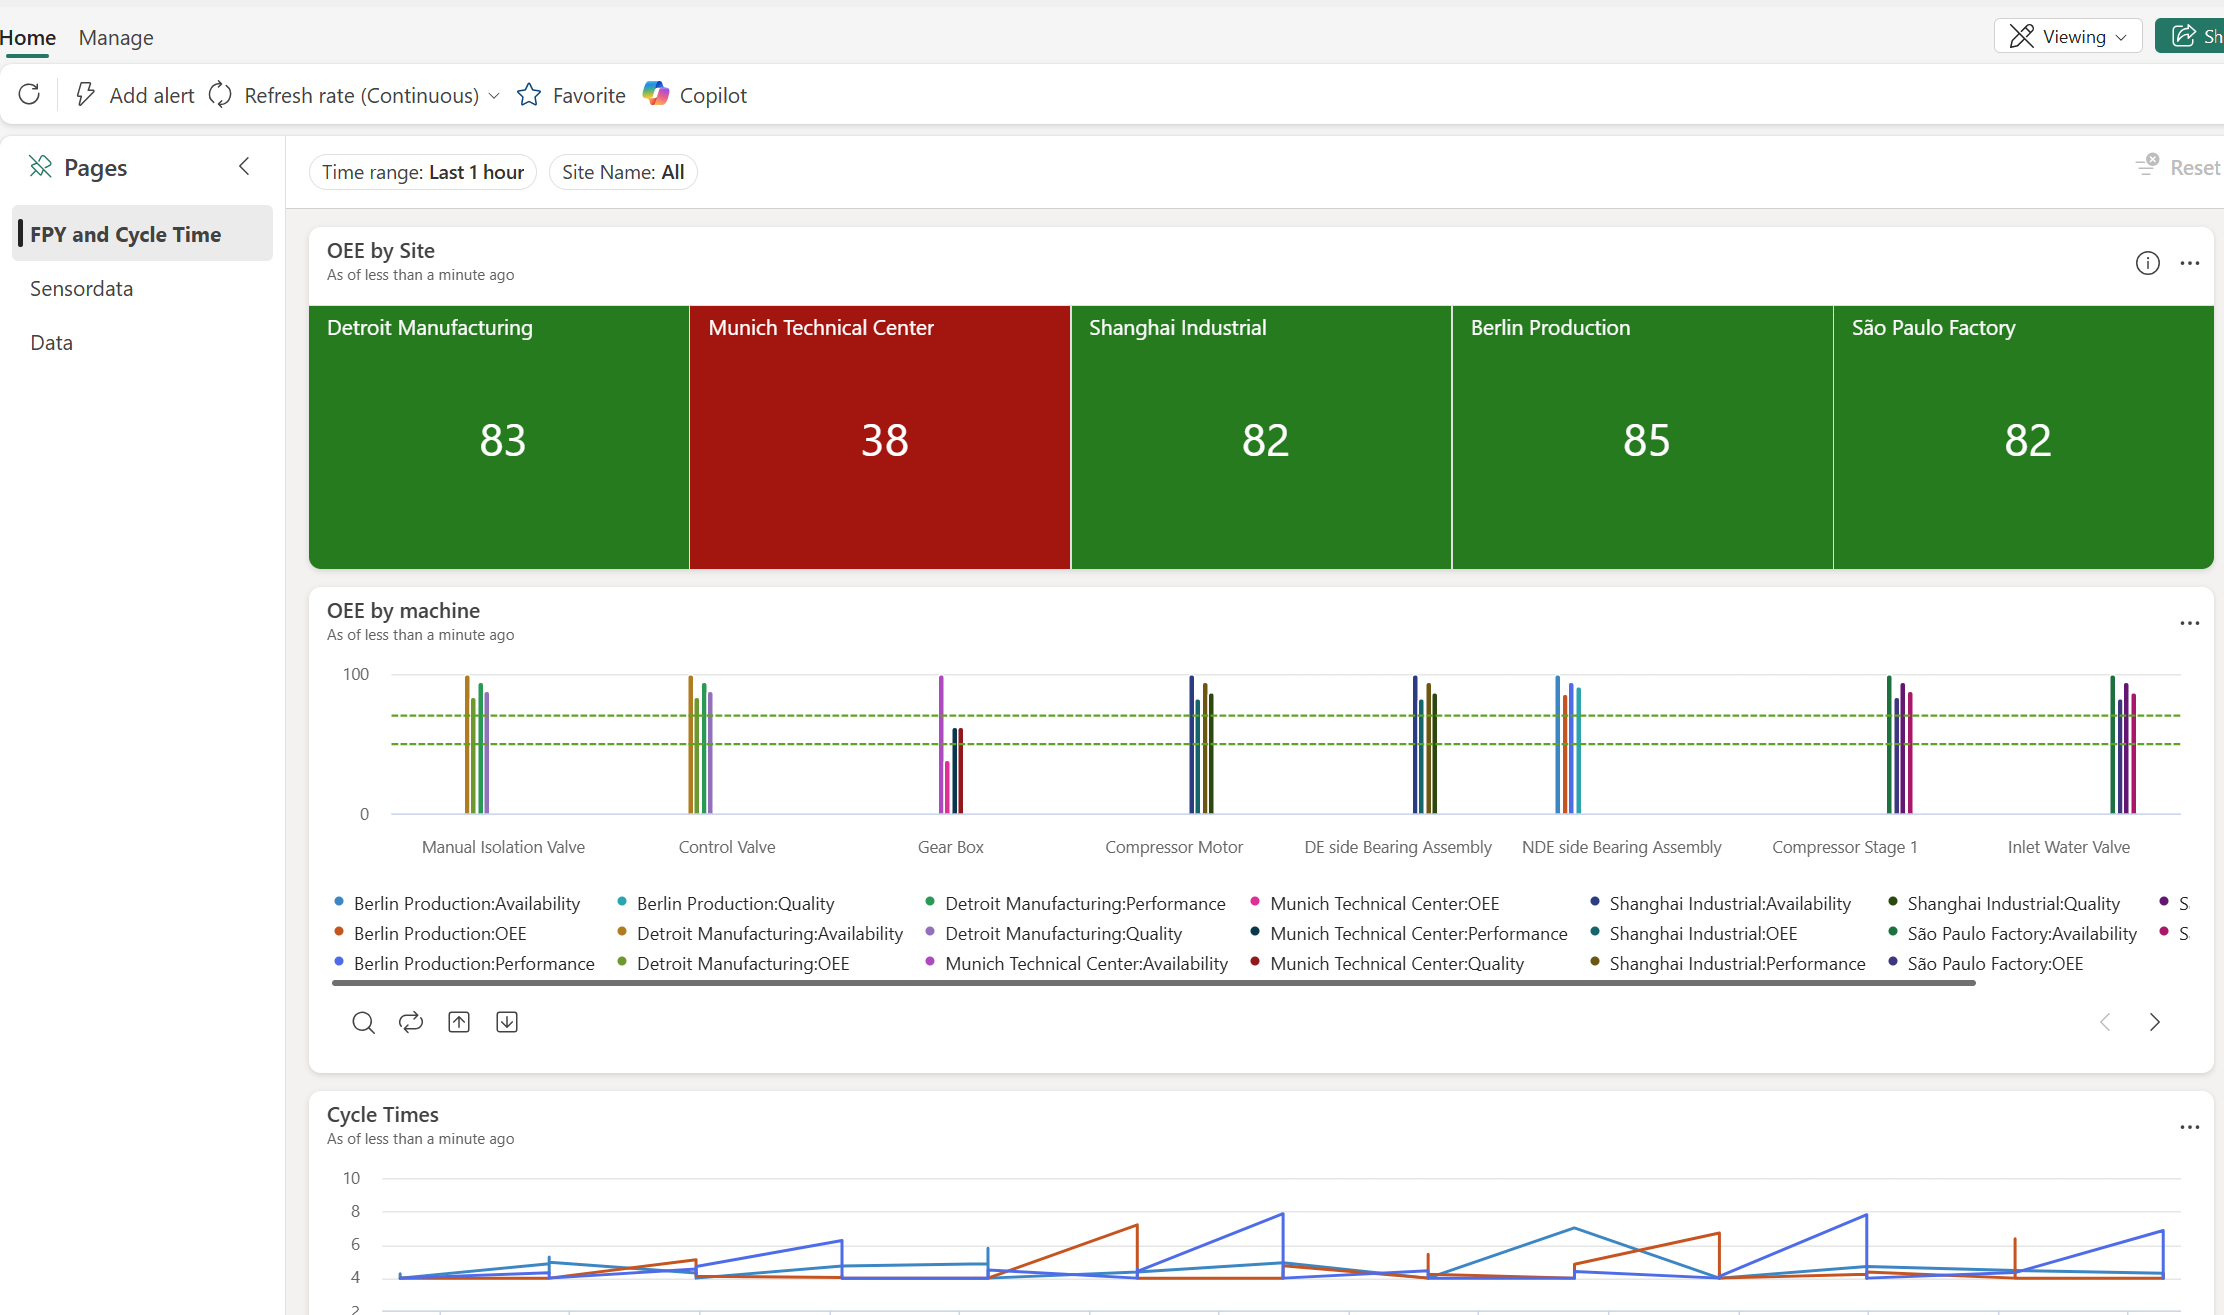
You see the core KPIs updating in real-time. Explore the other pages of this dashboard to drill down on sensor data timeseries and to see the most recent records arriving.
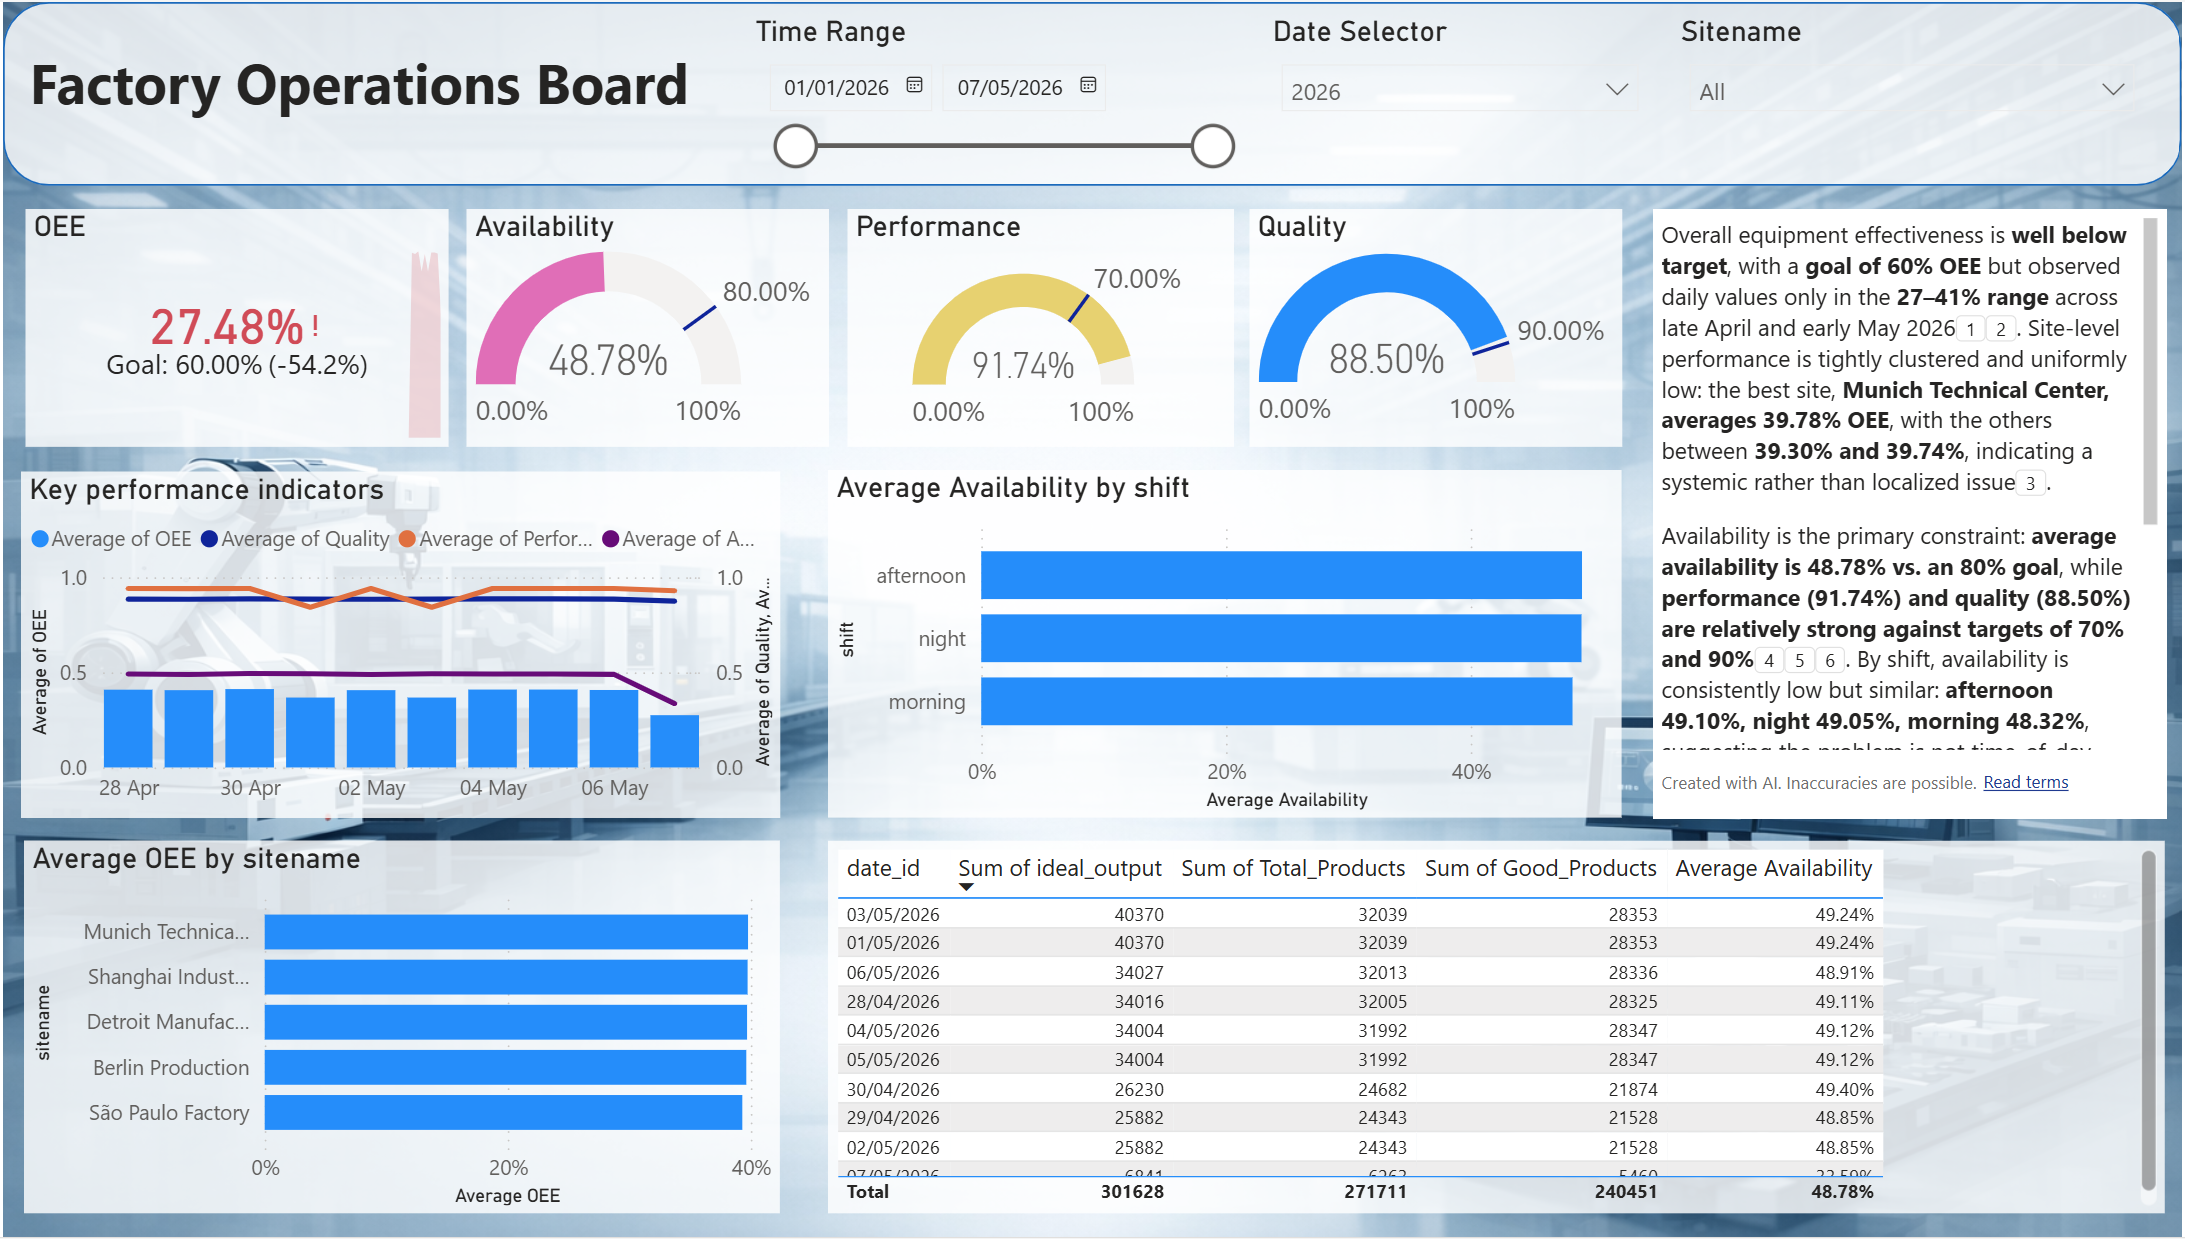
Once the PostDeploymentNotebook has been running for about 10 minutes, you can also go to the Power BI report ManufacturingOperationsReport and dive deeper on how KPIs have been trending over time, and how they differ by dimensions like sites, time, shifts and machines.
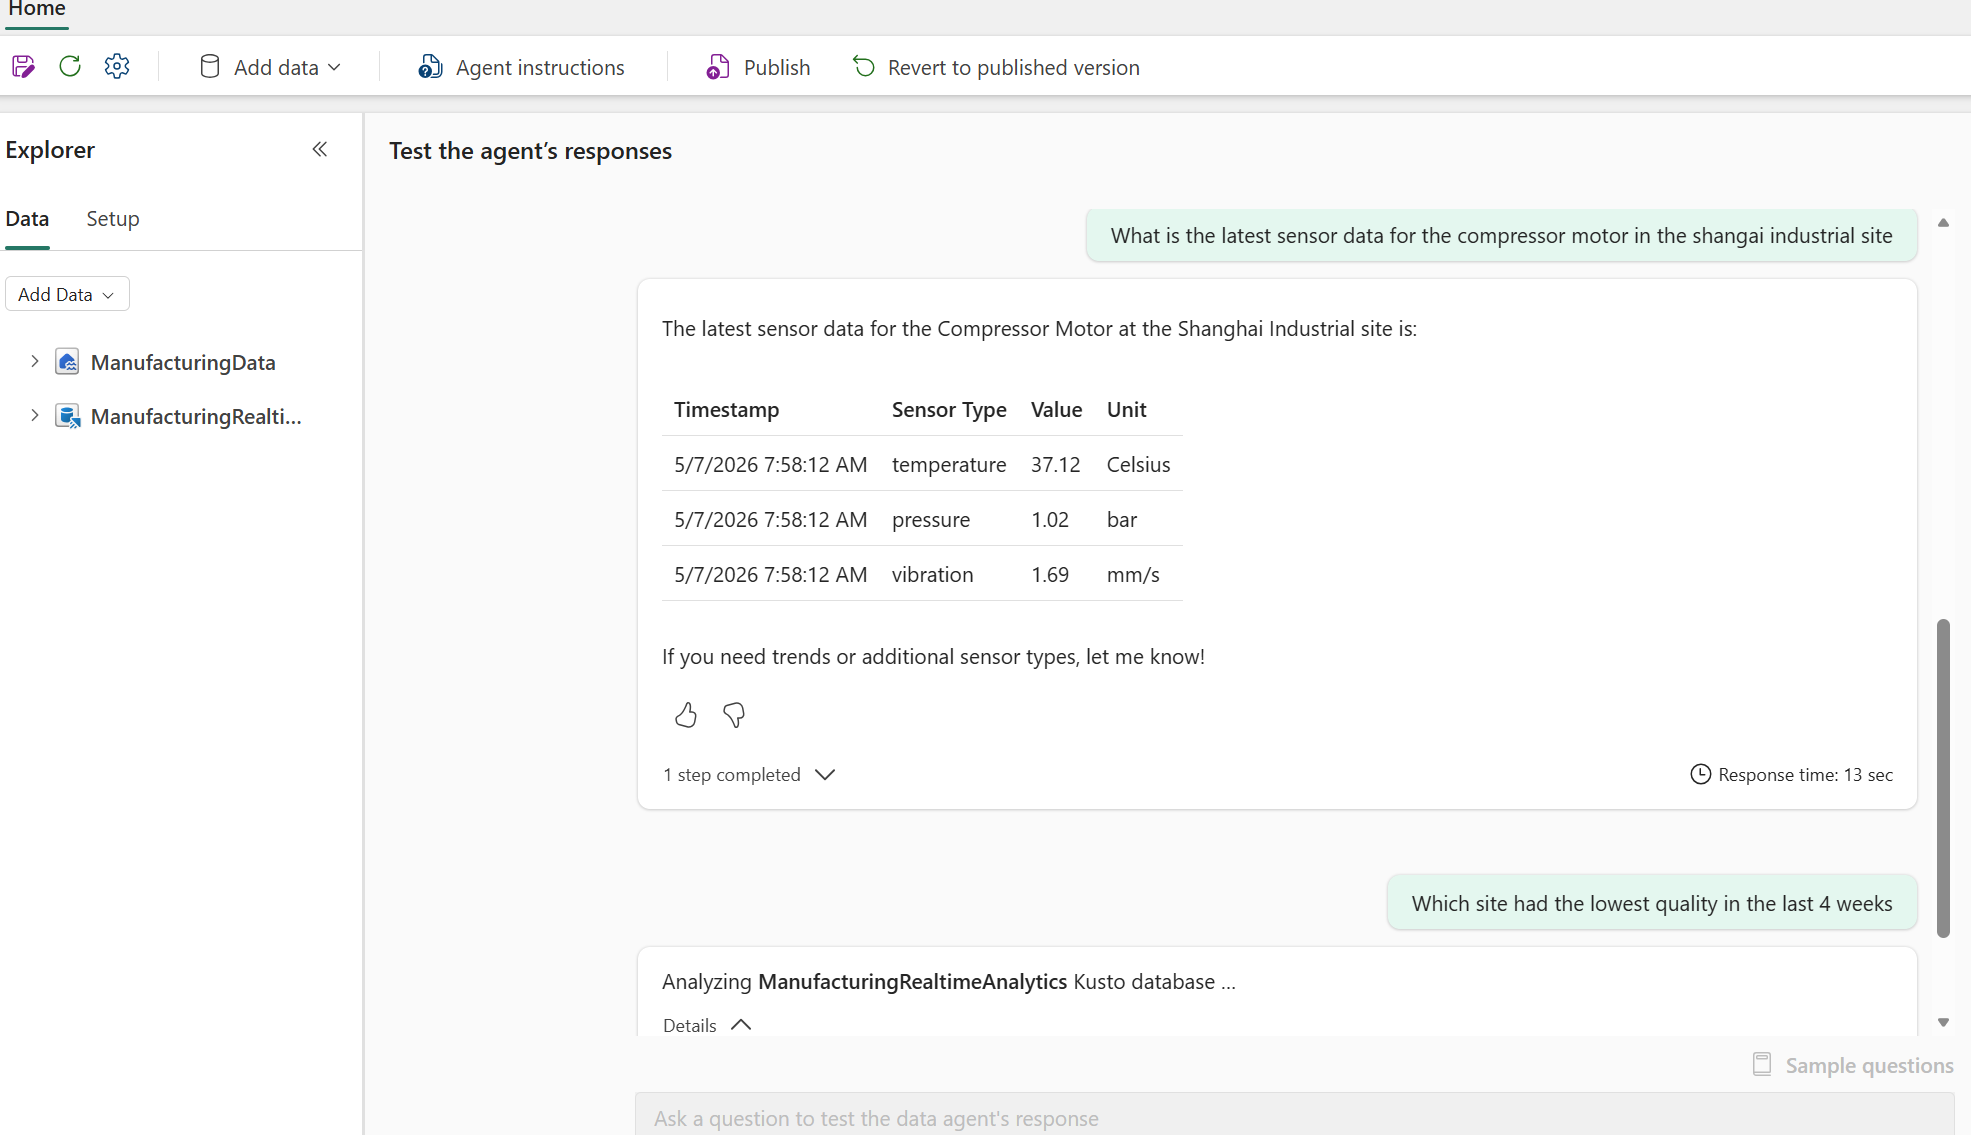
Lastly, open the 🤖 TalkToManufacturingData Data Agent and ask natural-language questions like "What is the latest sensor data for the compressor motor in the shangai industrial site?" or "Which site had the lowest quality in the last 4 weeks?":
Explore the Notebooks, Eventhouse KQL queries, and Pipelines to see how the entire solution fits together. 🔍
📁 Folder Organization
| Folder | Purpose |
|---|---|
AI/ | 🤖 Data Agent definition |
Develop/ | 📓 Notebooks (simulation, ingestion, streaming, master data) |
Eventhouse/ | 🔥 KQL Eventhouse for real-time telemetry |
Eventstream/ | 📡 MQTT and machine-data Eventstreams |
Lakehouse/ | 🏞️ Manufacturing Lakehouse |
Pipeline_orchestration.DataPipeline/ | 🪈 Orchestration pipeline |
PostDeploymentNotebook.Notebook/ | 🛠️ One-click setup after deployment |
Reporting/ | 📊 Power BI Report, Semantic Model, KQL Dashboard |
deploy.py | 🚢 fabric-cicd deployment script |
parameter.yml | 🎛️ Environment-specific parameter overrides |