
This jumpstart deploys a comprehensive solution accelerator for performing advanced anomaly detection using data from multiple variables with Microsoft Fabric's real-time intelligence capabilities.
The solution simulates a realistic industrial environment with:
- Sensor telemetry from two simulated centrifugal compressors, each instrumented with 25 sensors measuring speed, temperature, pressure, axial displacement and vibration.
- Vehicle tracking for field service crews and mobile assets
- Real-time intelligence using KQL (Kusto Query Language) for immediate operational visibility
- Anomaly detection by leveraging multivariate anomaly detection algorithms that enable predictive and conditional maintenance
- Advanced visualizations through Power BI reports and real-time dashboards
Business Value
- Immediate Operational Visibility: Monitor equipment statuses in real time
- Prevent Failures and Outages: Detect problems early and enable predictive and conditional maintenance
- Operational Efficiency: Track field service vehicles and optimize crew dispatch
Demonstration Video
✨ Key Features
- 🚀 One-Click Deployment: Automated installation notebook deploys all Fabric items with dependency management
- 📊 Real-Time Streaming: Eventstream ingestion for industrial sensor telemetry and vehicle telemetry
- 🔍 Advanced Analytics: KQL queries and machine learning models for time-series analysis, anomaly detection, and correlation
- 📈 Interactive Dashboards: Pre-built Power BI reports and KQL dashboards for operational monitoring
- 🎭 Realistic Simulation: Comprehensive data simulators based on real-world data
- 🏗️ Scalable Architecture: Built on Microsoft Fabric's lakehouse and eventhouse architecture
🏛️ Solution Architecture
High-Level Architectural Diagram
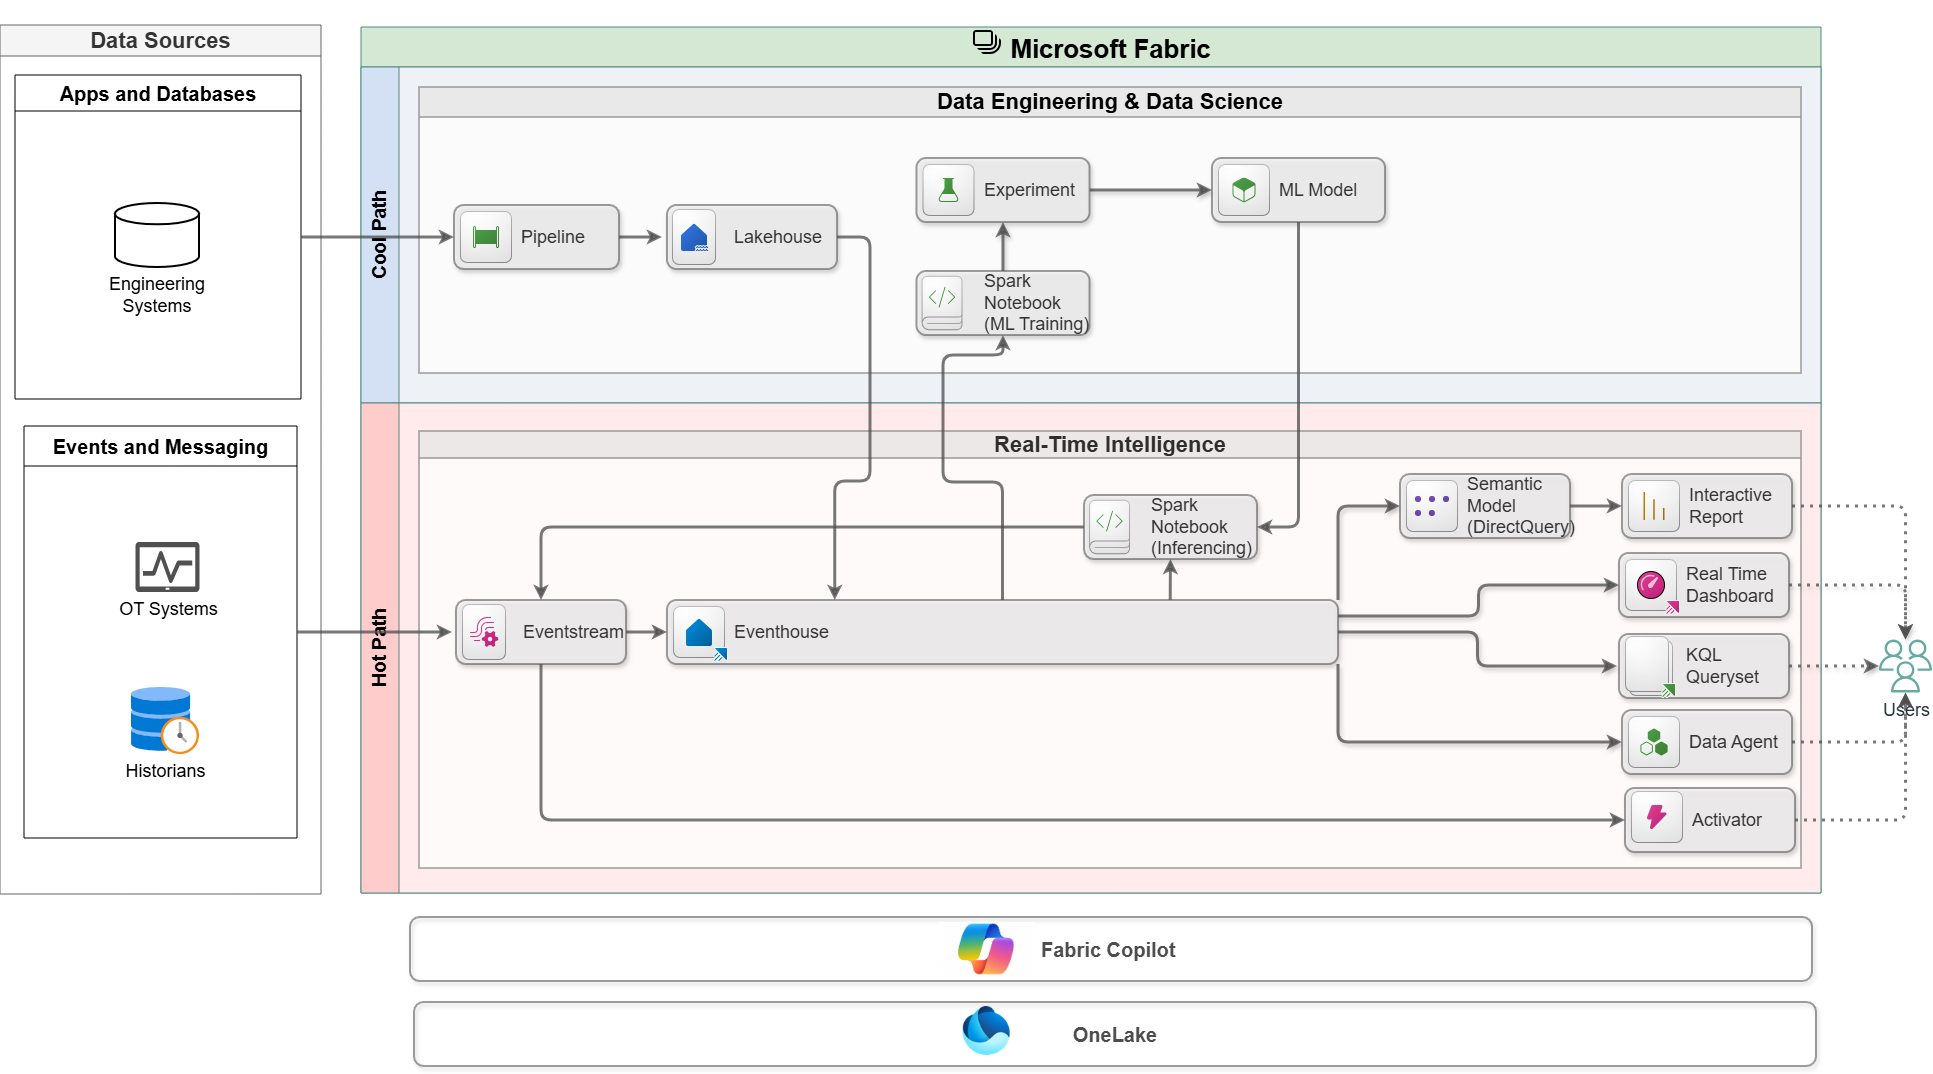
Note that this diagram represents a hypothetical real-world solution. This solution accelerator replaces source systems with Spark notebooks that generate synthetic data.
Component Details
Data Generation
- Industrial Telemetry Simulator: Generate realistic industrial telemetry (using real-world data that is converted into a simulated stream)
- Vehicle Simulator: Simulate routes for field service vehicles with speed and heading data
Ingestion
- Eventstreams: Fabric-native streaming connectors with built-in Event Hub endpoints.
Storage
- Eventhouse (KQL Database): Hot path for real-time queries with minimal latency
- Lakehouse (Delta Tables): Storage for reference data
Machine Learning
- Spark Notebooks are used to train machine learning models using specialized multivariate anomaly detection algorithms.
- Experiments are used to track machine learning runs using MLFlow.
- Machine Learning Models are registered and used for inferencing.
Analytics
- KQL Queries: Time-series analysis, aggregations, and correlation queries
- Power BI Semantic Models: DirectQuery mode connection to the eventhouse for real-time reporting
Visualization
- Maps: Real-time visualization of streaming and reference data.
- Real-Time Dashboards: Real-time visibility for key operational metrics.
- Power BI Reports: Time-series analysis, aggregations, and self-service analytics.
Action
- Activator: Event data is continuously analyzed and automated notification or actions are initiated when trigger conditions are satisfied.
📦 Prerequisites
Required
- Microsoft Fabric Capacity: F16 or higher recommended (Power BI Premium capacity is also supported). Note: this solution includes AI features that are not available on a Fabric Trial capacity. While you will be able to deploy the solution to a workspace on a Trial capacity, some portions of this solution will not work properly.
- Fabric Workspace: A workspace with contributor or admin permissions
- Power BI License: Power BI Pro or Power BI Premium Per User license.
Recommended Knowledge
- Basic understanding of Microsoft Fabric concepts (lakehouses, eventhouses, eventstreams)
- Familiarity with KQL (Kusto Query Language) for data exploration (optional)
- Familiarity with machine learning and data science using Spark
- Power BI experience for customizing reports (optional)
🚀 Installation Instructions
Step 1: Install the Multivariate Anomaly Detection Jumpstart
Step 2: Run the post-deployment notebook
- In your Fabric workspace, navigate to multivariate-anomaly-detection → Install → PostDeploymentConfig and open the notebook
- Run the notebook
The notebook will:
- ✅ Deploy an additional item (Fabric Map)
- ✅ Configure credentials and refresh all semantic models
- ✅ Post-process sample data
- ✅ Configure shortcuts in the KQL Database
Step 3: Enable Python plugin on the Eventhouse
- Navigate to the MultivariateAnomalyDetectionEH eventhouse in your workspace.
- Click on Plugins and enable the Python 3.11.7 (preview) plugin as illustrated below.
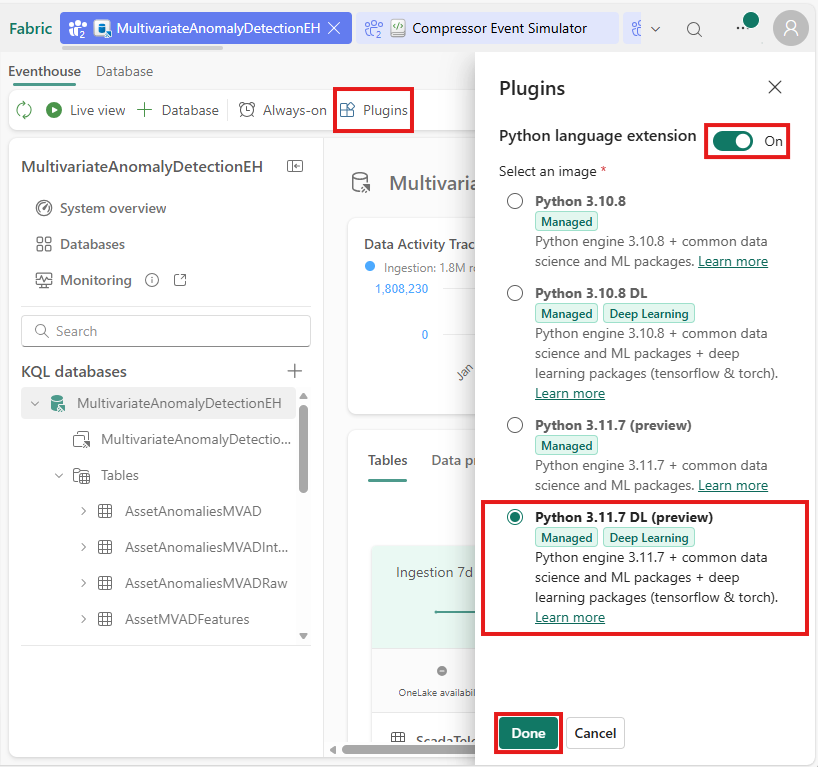
Enable Python Plugin
📖 Usage Instructions
Running Simulations
1. Start Compressor Event Simulator Notebook
- Open the CompressorEventSimulator notebook
- Click Run all
- Monitor progress in the output
2. Start Vehicle Tracking Simulation
- Open the VehicleTelemetrySimulator notebook
- Click Run all
- Vehicles will follow predefined routes with realistic GPS tracking
Viewing Reports and Dashboards
Maps
AssetStatus Map
- Visualize the health of assets across the enterprise
- Visualize locations of service vehicles
Access: Navigate to VisualizeAndChat → AssetStatus
Real Time Dashboards
ScadaTelemetryAnomalies Dashboard
- Real-time asset monitoring
- Sensor telemetry monitoring
Access: Navigate to VisualizeAndChat → ScadaTelemetryAnomalies
Power BI Reports
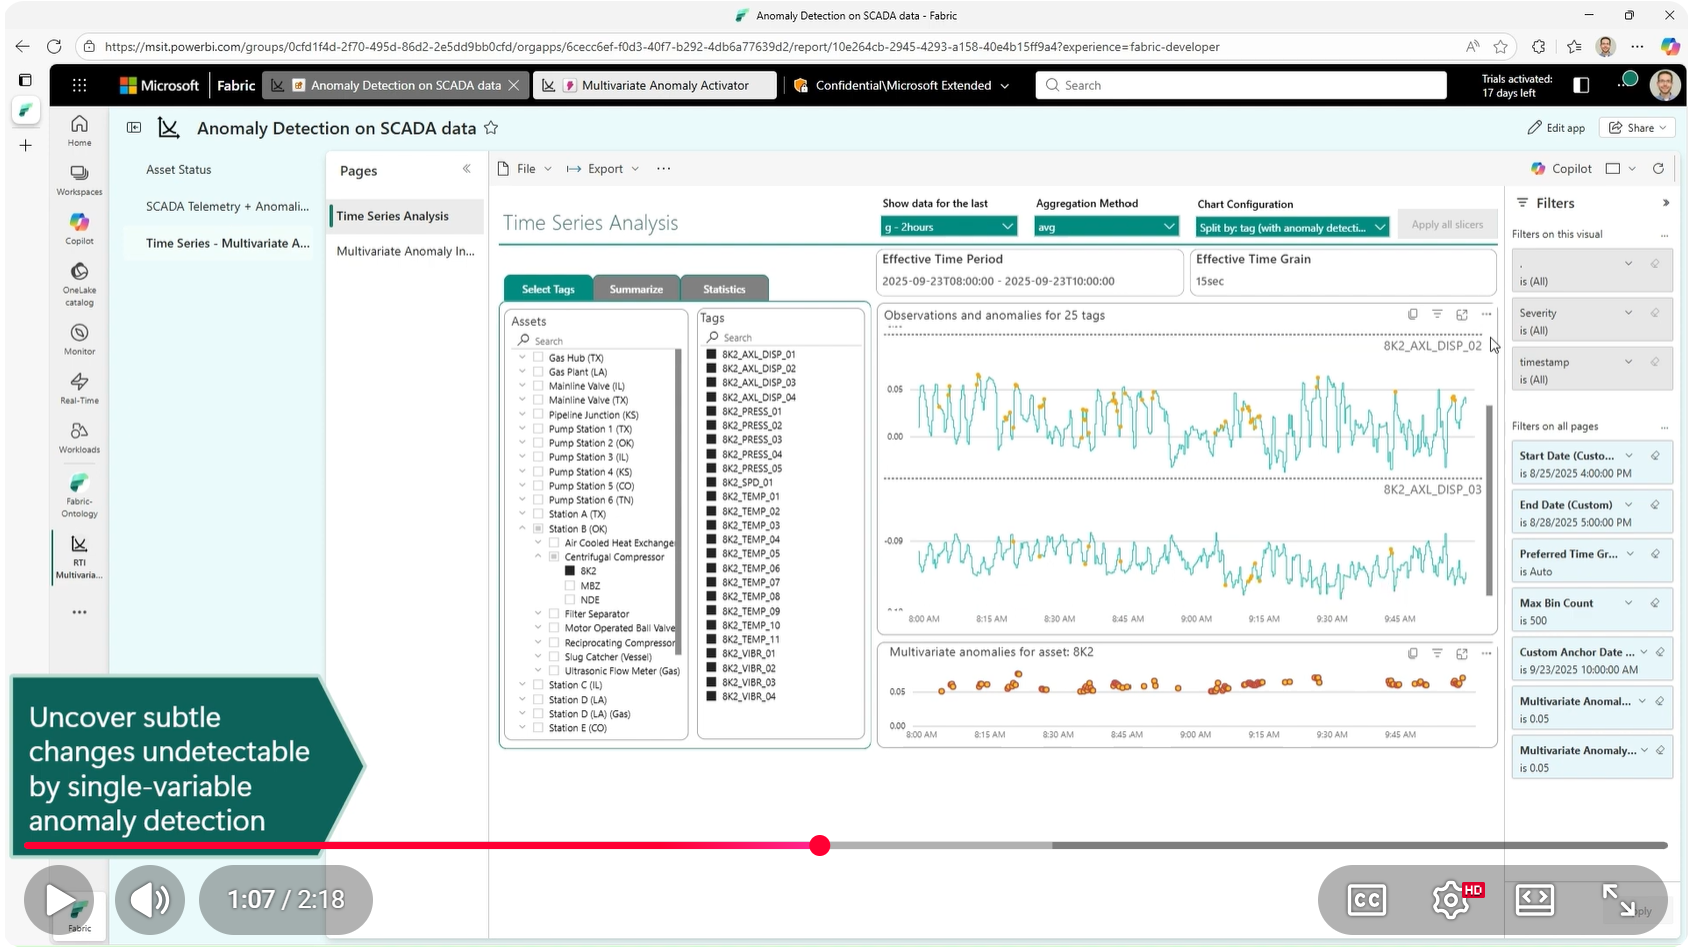
TimeSeriesMultivariateAnomalyAnalysis
- Flexible time series analysis of data from multiple sensors
- Single-variable anomaly detection for each time series
- Multivariate anomaly detection
- Diagnostic capabilities for multivariate data
- Descriptive statistics and correlation analysis between selected tags
Using Activator (for automated alerts and actions)
The MultivariateAnomalyActivator enables automatic alerts when trigger conditions are met.
By default, the Activator is configured to generate alerts when multiple moderate severity multivariate anomalies have been detected or when individual high-severity anomalies have been detected. You may configure other triggers using the no-code authoring interface.
Access: Navigate to Act → MultivariateAnomalyActivator
🔧 Troubleshooting
If you encounter challenges with the solution, consider the following steps:
- Ensure that all pre-requisites have been fully satisfied
- Ensure that all installation steps have been completed in order
- Ensure that you have manually enabled the Python plugin on your Eventhouse (as described in the installation instructions above.)
- Ensure that simulation notebooks are actively running -- it may take a few minutes for simulated data generators to start producing simulated events.
Getting Help
- Microsoft Fabric Documentation: https://learn.microsoft.com/fabric/
- Community Forums: Fabric Community
📄 License
This project is provided as-is for demonstration and educational purposes.