
This jumpstart deploys a comprehensive solution for power utilities to monitor and optimize electrical grids using Advanced Metering Infrastructure (AMI) data with Microsoft Fabric's real-time intelligence capabilities.
The solution simulates a realistic utility grid environment with:
- Smart meter telemetry from thousands of meters reporting power consumption, voltage, current, and power quality metrics
- Vehicle tracking for field service crews and mobile assets
- Weather data integration to correlate environmental conditions with grid performance
- Real-time intelligence using KQL (Kusto Query Language) for immediate operational visibility
- Advanced visualizations through Power BI reports and real-time dashboards
Business Value
- Proactive Outage Management: Detect and respond to outages in real-time with correlated meter and weather data
- Grid Optimization: Identify power quality issues, load imbalances, and infrastructure stress points
- Operational Efficiency: Track field service vehicles and optimize crew dispatch
- Predictive Maintenance: Detect meter failures, battery issues, and tamper events before they escalate
Demonstration Video
✨ Key Features
- 🚀 One-Click Deployment: Automated installation notebook deploys all Fabric items with dependency management
- 📊 Real-Time Streaming: Azure Event Hubs ingestion with Eventstreams for AMI, vehicle, and weather data
- 🔍 Advanced Analytics: KQL queries for time-series analysis, anomaly detection, and correlation
- 📈 Interactive Dashboards: Pre-built Power BI reports and KQL dashboards for operational monitoring
- 🎭 Realistic Simulation: Comprehensive data simulators with seasonal patterns, outages, and failure scenarios
- 🏗️ Scalable Architecture: Built on Microsoft Fabric's lakehouse and eventhouse architecture
- 🤖 AI-Ready: Includes Fabric Data Agent integration for natural language queries and incorporates Smart Narratives to facilitate interpretation of Power BI reports
🏛️ Solution Architecture
High-Level Architectural Diagram
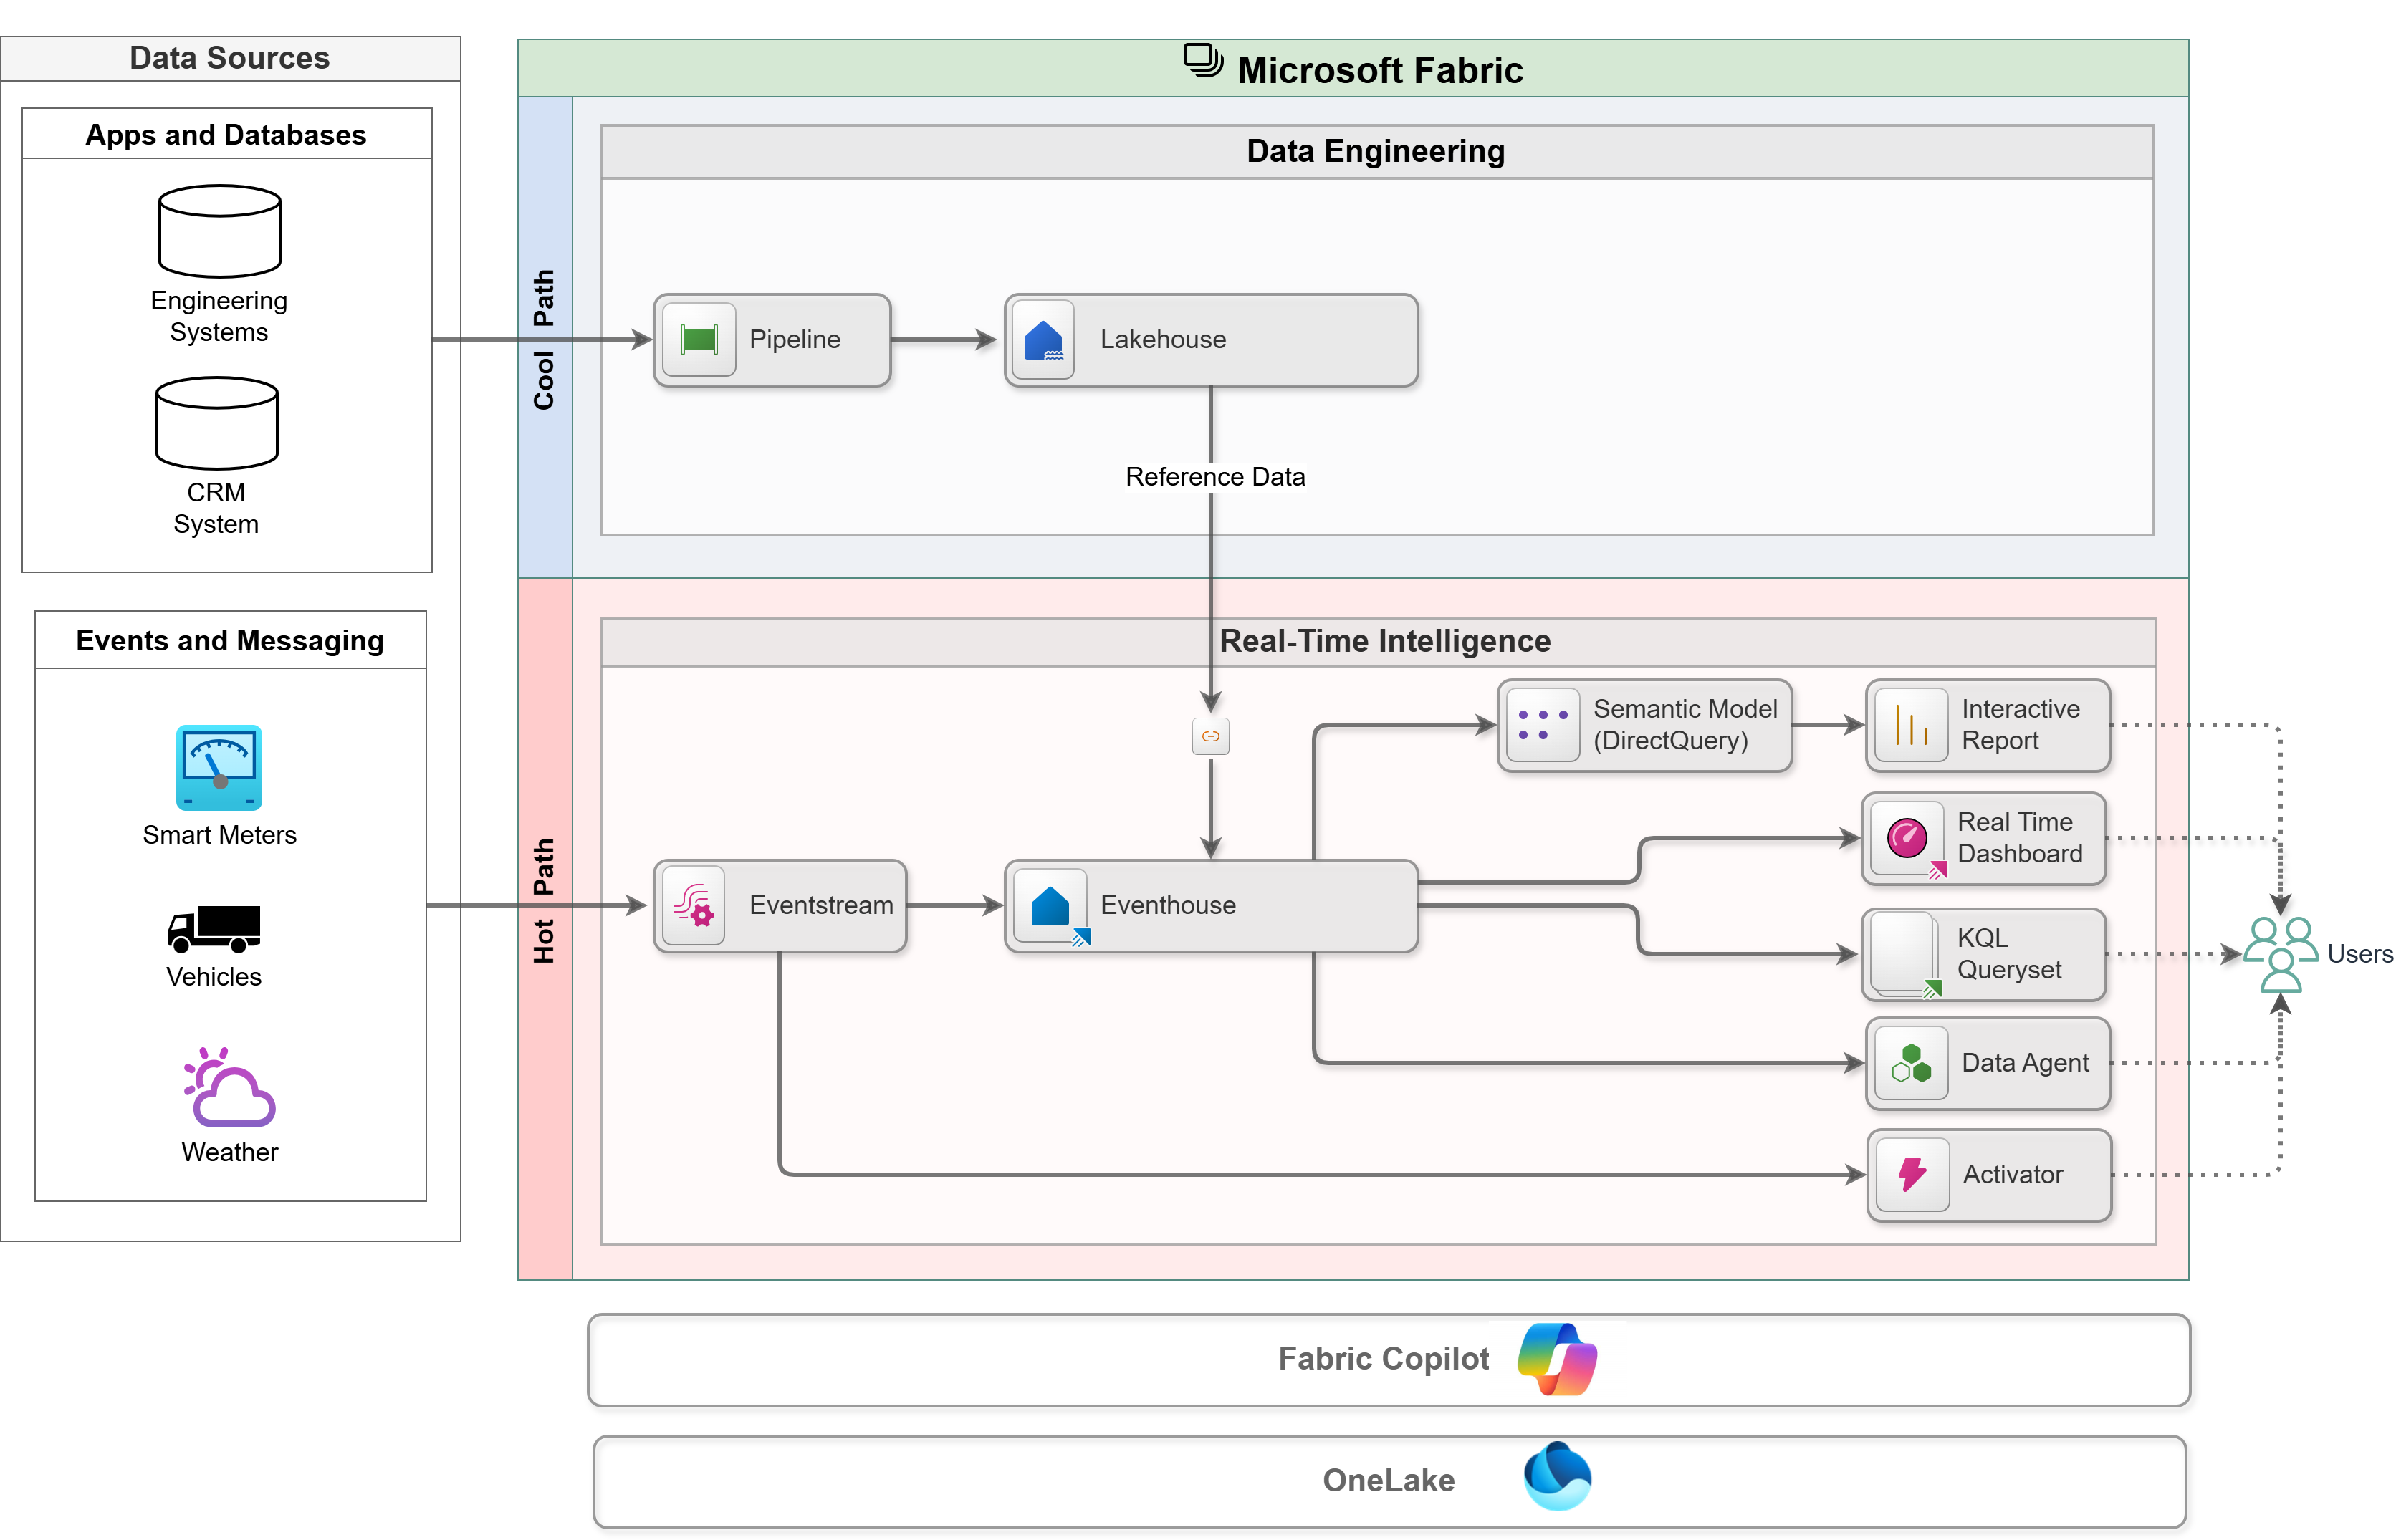
Note that this diagram represents a hypothetical real-world solution. This solution replaces source systems with Spark notebooks that generate synthetic data.
Component Details
Data Generation
- AMI Simulators: Generate realistic smart meter telemetry with seasonal/daily patterns, failures, and outage scenarios
- Vehicle Simulator: Simulate routes for field service vehicles with speed and heading data
- Storm Simulator: Create weather events that trigger correlated grid outages
Ingestion
- Eventstreams: Fabric-native streaming connectors with built-in Event Hub endpoints.
Storage
- Eventhouse (KQL Database): Hot path for real-time queries with minimal latency
- Lakehouse (Delta Tables): Storage for reference data with seamless integration with the eventhouse
Analytics
- KQL Queries: Time-series analysis, aggregations, and correlation queries
- Power BI Semantic Models: DirectQuery mode connection to the eventhouse for real-time reporting
- Data Agent: AI-powered natural language interface to query grid data
Visualization
- Maps: Real-time visualization of streaming and reference data.
- Real-Time Dashboards: Real-time visibility for key operational metrics.
- Power BI Reports: Time-series analysis, aggregations, and self-service analytics.
Action
- Activator: Event data is continuously analyzed and automated notification or actions are initiated when trigger conditions are satisfied.
📦 Prerequisites
Required
- Microsoft Fabric Capacity: F16 or higher recommended (Power BI Premium capacity is also supported). Note: this solution includes AI features that are not available on a Fabric Trial capacity. While you will be able to deploy the solution to a workspace on a Trial capacity, some portions of this solution will not work properly.
- Fabric Workspace: A workspace with contributor or admin permissions
- Power BI License: Power BI Pro or Power BI Premium Per User license.
Recommended Knowledge
- Basic understanding of Microsoft Fabric concepts (lakehouses, eventhouses, eventstreams)
- Familiarity with KQL (Kusto Query Language) for data exploration (optional)
- Power BI experience for customizing reports (optional)
🚀 Installation Instructions
Step 1: Install the Grid Intelligence Jumpstart
Step 2: Run the post-deployment notebook
- In your Fabric workspace, navigate to grid-intelligence → Install → PostDeploymentConfig and open the notebook
- Run the notebook
The notebook will:
- ✅ Deploy an additional item (Fabric Map)
- ✅ Configure credentials and refresh all semantic models
- ✅ Post-process sample data
- ✅ Configure shortcuts in the KQL Database
📖 Usage Instructions
Running Simulations
When you run the post-deployment notebook, all event simulator notebooks will be started automatically. You may skip to the Viewing Reports and Dashboards section.
By default, these simulations will run for 2 hours and stop. To restart the simulations, please follow these steps:
1. Start AMI Telemetry Simulation
- Open the AMITelemetryAndOutageSimulation notebook
- Click Run all
- Monitor progress in the output (status printed every minute)
Data Generated:
- Power consumption (kW, voltage (V), current (A), etc.)
- Power quality metrics (power factor, THD, etc.)
- Meter health indicators (battery, tamper detection)
- Outage events (last gasp, restoration)
2. Start Vehicle Tracking Simulation
- Open the VehicleTelemetrySimulator notebook
- Click Run all
- Vehicles will follow predefined routes with realistic GPS tracking
3. Start Storm Simulation
- Open the StormSimulation notebook
- Click Run all
- Observe progression of the storm by opening the Meter Analytics report and navigating to the Meter Outages + Weather page. Note that storm progression is accelerated -- it will take ~2 minutes for the storm to pass through the service area.
- Storm events will trigger correlated meter outages in the AMI simulation (when AMITelemetryAndOutageSimulation notebook is running)
- New storm fronts will continue to pass through the service area while the simulation is in progress.
Viewing Reports and Dashboards
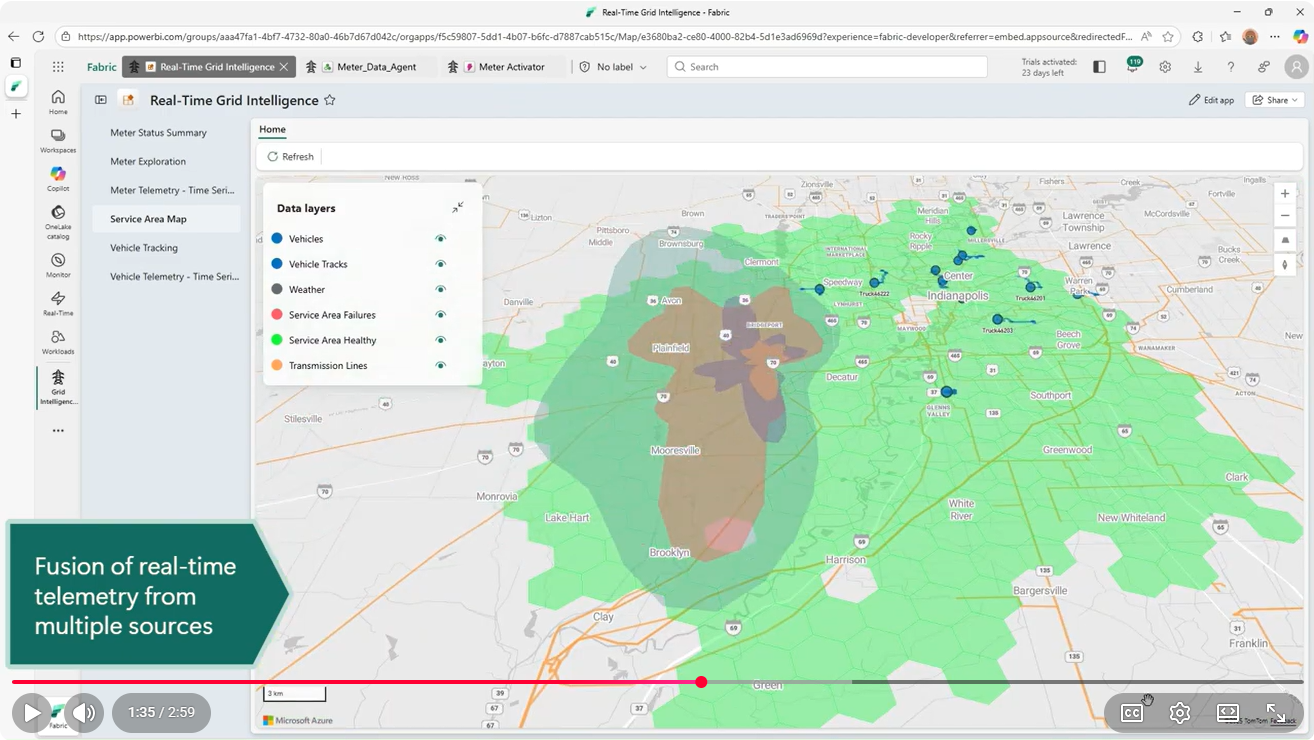
Maps
ServiceAreaMap
- Visualize the health of meters across the service area
- Visualize weather data
- Visualize locations of service vehicles
- Display location of electrical transmission lines
Access: Navigate to Visualize and Chat → ServiceAreaMap
Real Time Dashboards
MeterStatuses Dashboard
- Real-time meter health monitoring
- Outage maps and timelines
- Power quality monitoring
Access: Navigate to Visualize and Chat → MeterStatuses
VehicleTracking Dashboard
- Live vehicle locations on map
- Route history and playback
- Speed and vehicle telemetry metrics
Access: Navigate to Visualize and Chat → VehicleTracking
Power BI Reports
MeterExploration Report
- Customer consumption patterns
- Recent trends in power consumption and quality metrics
MeterTelemetryTimeSeriesAnalysis
- Multi-meter comparison views
- Flexible time series analysis of metrics from individual meters
- Anomaly detection
- Descriptive statistics and correlation analysis between selected tags
VehicleTelemetryTimeSeriesAnalysis
- Fleet performance metrics
- Vehicle health and performance monitoring
Using the Data Agent (AI Copilot)
The MeterDataAgent enables natural language queries:
Example queries:
- "Show me all meters with outages in the last hour"
- "What transformer has the highest number of meters impacted by an outage?"
- "Which vehicle is closest to transformer XYZ?"
- "What's the average power consumption by feeder line and service class?"
- "Which meters have low battery warnings?"
Access: Navigate to Visualize and Chat → MeterDataAgent
Using Activator (for automated alerts and actions)
The MeterActivator enables automatic alerts when trigger conditions are met.
By default, the Activator is configured to generate alerts when the level of total harmonic distortions exceeds a specified threshold and stays at that level for an extended period of time. You may configure other triggers using the no-code authoring interface.
Access: Navigate to Act → MeterActivator
🔧 Troubleshooting
If you encounter challenges with the solution, consider the following steps:
- Ensure that all pre-requisites have been fully satisfied
- Ensure that all installation steps have been completed in order
- Ensure that simulation notebooks are actively running -- it may take a few minutes for simulated data generators to start producing simulated events.
- Ensure that simulation notebooks are actively running -- by default, meter and vehicle simulations will time out and terminate after 2 hours. Storm simulation will terminate after 2 minutes.
Getting Help
- Microsoft Fabric Documentation: https://learn.microsoft.com/fabric/
- Community Forums: Fabric Community
📄 License
This project is provided as-is for demonstration and educational purposes.